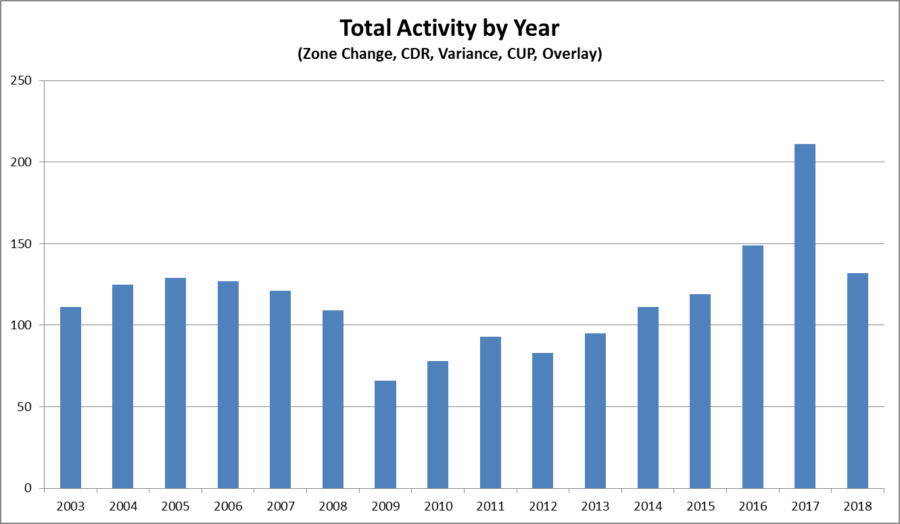

We’re continually reporting on growth in our community in a variety of ways. Bowling Green and Warren County have experienced a substantial increase in development – commercial and residential – after seeing a dip in trends after the 2008 housing crisis. While our numbers for development approvals are certainly less than 2017 as shown in Figure 2 below, taking a look at growth trends over the past fifteen years shows 2018 as a year of continued growth in development approvals, albeit at a slower pace than the past two years (Figure 2). What is NOT shown in the graph is our construction numbers. Looking at the Figure 1 table for Building Permits Reviewed, Construction Plans Reviewed, and Engineering Inspections you will see large increases. The community is building most everything approved in our past two record years. Don’t believe us? Take a drive out most any US Highway and you can see all of the construction in progress.
We get a lot of questions and comments about apartments versus single family. Figure 1 shows that in 2017 we had 2,212 new multi-family units approved for construction and 1,121 single family lots approved. The number of apartment units approved was reduced by 65% in 2018 with less than 800 multi-family units approved. Single family lot approvals stayed about the same with only a 10% decrease. What does all of this mean? It simply means we approved fewer apartments in 2018 than 2017. The housing market could be adjusting some or trends could be changing. The future of the housing marking will be hard to predict the next few years as the developers and banking industry adjust to variables such as rising interest rates and changing consumer demand. A housing study for our community currently being conducted by the City of Bowling Green will hopefully provide some insight into the future of housing market.
With growth and development being hot topics in our community in recent years, the Planning Commission has worked to be flexible to provide the necessary services to keep up with the needs of the community. Over the past year, we’ve streamlined many of our processes – including our new comprehensive development review (CDR) process, revised the zoning ordinance, and various functions of the Metropolitan Planning Organization (MPO). We’ve also hired a code enforcement/zoning compliance officer to monitor and enforce compliance of existing development. Figure 1 under the Code Enforcement heading shows the efforts of this recommitment to this community service.
As we start this new year, we hope to continue to improve upon the services we provide to the community. Some goals we strive to achieve in the upcoming year include continuing to streamline processes, improve plat review times, keep up with the pace of growth and construction, discuss sign regulations, and look at another area to complete a Focal Point Plan.
Figure 1
Planning Commission Numbers | Quarter & Annual Review
Oct-Dec Total |
Oct-Dec City |
Oct-Dec County |
2018 Overall Total |
2017 Overall Total |
% Change from 2017 |
|
| Single Family Lots Approved |
112 |
0 | 112 | 995 | 1,121 |
-11% |
| Multi-Family Units Approved |
0 |
0 | 0 | 768 | 2,212 |
-65% |
| Zone Changes Approved |
11 |
2 | 9 | 53 | 66 |
-20% |
| Detailed Development Plans Approved |
0 |
0 | 0 | 4 | 32 |
-88% |
| Subdivision Approvals |
39 |
12 | 27 | 197 | 230 |
-14% |
Subdivision Construction |
||||||
| Construction Plans Reviewed |
16 |
6 | 10 | 63 | 6 |
950% |
| Engineering Inspections |
595 |
272 | 323 | 2,722 | 683 |
299% |
Code Enforcement |
||||||
| Zoning Complaints |
82 |
56 | 26 | 264 | 23 |
1,048% |
| Site Inspections |
74 |
50 | 24 | 243 | 23 |
957% |
| Notices of Violation |
32 |
25 | 7 | 120 | 11 |
991% |
Geographic Information Systems (GIS) |
||||||
| Maps Created |
92 |
31 | 61 | 437 | 109 |
301% |
| Addresses Assigned |
266 |
132 | 134 | 1,076 | 413 |
161% |
| Parcels Drawn |
901 |
182 | 719 | 3,634 | 1,165 |
212% |
Plan Review Services |
||||||
| Building Permits Reviewed |
371 |
193 | 178 | 2,164 | 400 |
441% |
Figure 2